

Overview
The Dashboard is where you manage what your store sells, its orders, products, customers, and settings, while the Builder is where you design how your store looks.
The dashboard home gives you an at-a-glance view of how your store is performing and quick access to everything you manage.
The dashboard has two states. Until you finish the initial setup steps, it shows a setup checklist to guide you through getting your store ready to sell. Once setup is complete, it switches to the performance view described below, your key metrics, sales charts, and widgets.
Welcome header
At the top you'll find a personalised welcome (for example Welcome back, William Davis) along with these controls:
- Store URL. A pill showing your store's address (for example pulsedrinks.orderain.com). Click the address to open your live storefront, or use the copy icon to copy it to your clipboard.
- Edit Site. Jump straight into the Builder to change how your storefront looks.
- Date range. Choose the time period the metrics are calculated for (for example Last 3 months).
- Compare. Compare the selected period against another (for example Previous period).
Finishing store setup
When your store is new, the dashboard shows a Finish setting up your store checklist instead of the performance view. A progress bar (for example 2 of 5) tracks how far along you are, and each step links straight to where you complete it:
- Add your first category. Categories drive your storefront navigation, filters, and category pages. Click Add a category, or Skip for now to come back later.
- Add your warehouse. Set up where your stock is held.
- Add your first product. Put something of your own up for sale, click Add a product.
- Set up your shipping rates. Choose how much delivery costs.
- Set up a payment method. Choose how customers pay you, click Set up payment.
Completed steps show a green check. Below the checklist, an After setup row points you to what comes next, Design your storefront (Open editor), Invite your team (Add staff), and Connect a domain (Add domain).
Once every step is done, the checklist disappears and the dashboard shows your key metrics, sales charts, and widgets.
Ask Buddy and Storefront Preview
While you're setting up, two panels sit alongside the checklist:
- Ask Buddy. Describe what you want in plain language, edit your store, create images, or get sales insights, and Buddy does it. It also suggests starter prompts like Create 5 categories for a clothing store or How are my sales this week?
- Storefront Preview. A live thumbnail of your storefront with a View your store link, so you can see how it looks as you build.
Key metrics
A row of stat cards summarises your store's performance for the selected date range:
- Total Sales, your total revenue.
- Total Orders, how many orders were placed.
- Returning Customers, the share of customers who came back.
- Site Visits, how many times your store was visited.
Each card shows the current value and the percentage change vs the previous period.
Sales charts
Two charts break down your revenue:
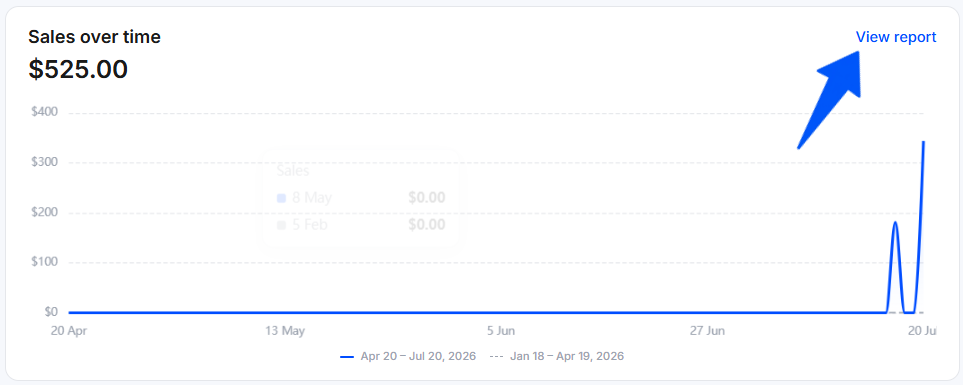
- Sales over time. A line chart of your sales across the selected range, with a dashed line comparing the previous period. Click View report for the full breakdown.
- Sales by category. A donut chart showing total sales split by product category, with each category's share and amount.
The full sales report
On the Sales over time chart, click the View report button in the top right.
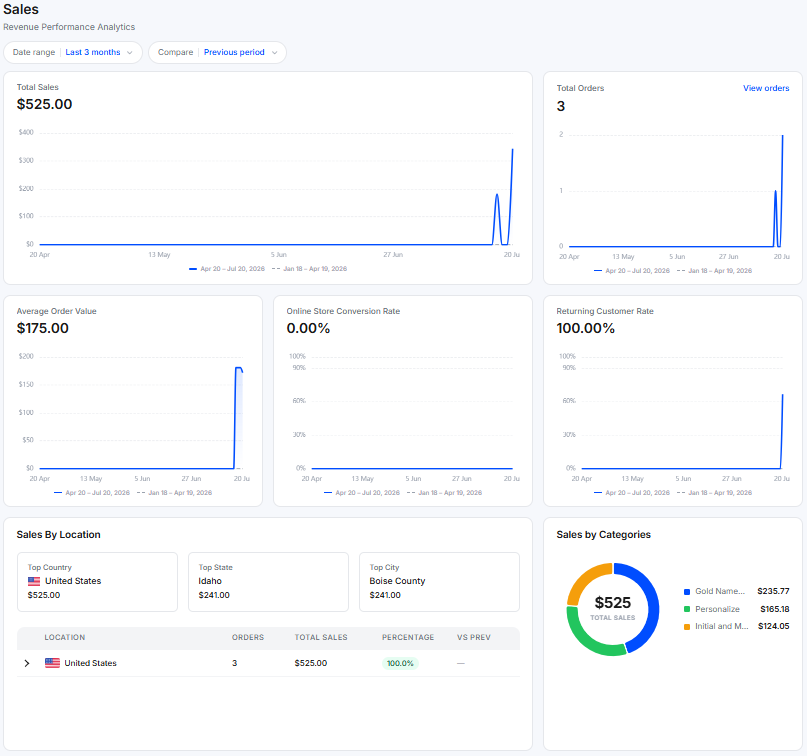
This opens the full Sales, Revenue Performance Analytics page. It has its own Date range and Compare controls, plus a complete breakdown of your revenue:
- Total Sales, Total Orders, Average Order Value, Online Store Conversion Rate, and Returning Customer Rate, each as a trend chart versus the previous period.
- Sales By Location. Your top country, state, and city, with an orders and sales table by location.
- Sales by Categories. A donut chart splitting total sales across product categories.
Dashboard widgets
A set of widgets highlights what needs your attention. Click View more on any widget to open the full section.
- Recent Orders. The latest orders, each with its status (Unfulfilled, Processing, Delivered), item count, amount, and time.
- Top Selling Products. Your best-performing products, with sales count and margin.
- Low Stock. Products running low on inventory, with how many are left.
- Top Paying Customers. The customers who spend the most.
- Abandoned Orders. Your abandoned cart rate and the potential revenue you could recover, plus the abandoned orders themselves.
- Quick Actions. Shortcuts to the actions you use most.
Quick Actions
Quick Actions let you add one-click shortcuts to the dashboard. Click Add new shortcut to open the Add New Shortcut dialog, search the list, and Add the actions you want, for example:
- Add Product, Create Order, Add Staff Member, Add Customer, Create Coupon, Add Warehouse, and Create Shipping Rate.
Click Save to keep your shortcuts, or Manage all shortcuts to edit them later.
The sidebar
The left sidebar is how you navigate the dashboard:
- Dashboard. This overview page.
- Orders. View and manage customer orders.
- Products. Add and manage products and inventory.
- Customers. View your customers and their details.
- Analytics. Dig deeper into your store's performance.
- Coupons. Create and manage discount codes.
- Plugins. Add and configure integrations.
- Staff Management. Manage team members and their access.
- Settings. Configure your store's settings.